Image Details
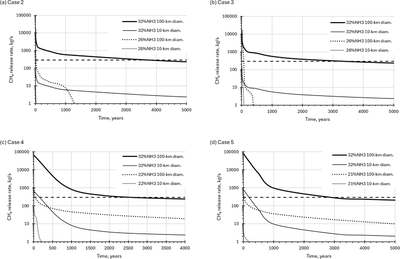
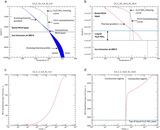
Caption: Figure 6.
Release of methane as a function of time (upper limit). Panels (a) and (b) are Cases 2 and 3. Panels (c) and (d) are cases 4 and 5. Profiles are shown for different depths of clathrate layer (5 km for Cases 2 and 3, and 10 km for Cases 4 and 5) and for the MCH brine pocket ammonia content limits, from a maximum of 32wt% down to the lowest ammonia content value where MCH is still destabilized. The horizontal dashed line denotes the required atmospheric replenishment rate of methane (290 kg s−1).
(The data used to create this figure are available in the online article.)
(The data used to create this figure are available.)
Other Images in This Article
Copyright and Terms & Conditions
© 2026. The Author(s). Published by the American Astronomical Society.