Image Details
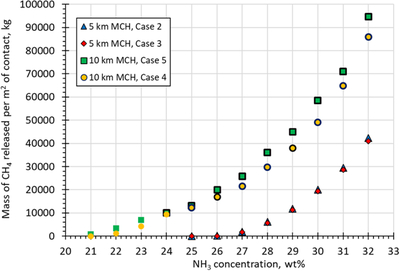
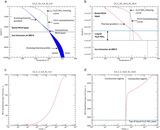
Caption: Figure 5.
Thicknesses of MCH destabilized and masses of methane released as a function of the MCH brine pocket ammonia content. The thermal gradients for the different cases are shown in Figure 2. For Cases 4 and 5, examples (with heavy black borders) are given for scenarios where a layer of water + ammonia is already present at the start of the model run.
Other Images in This Article
Copyright and Terms & Conditions
© 2026. The Author(s). Published by the American Astronomical Society.
Copyright ©
2026 Astronomy Image Explorer. All Rights Reserved.