Image Details
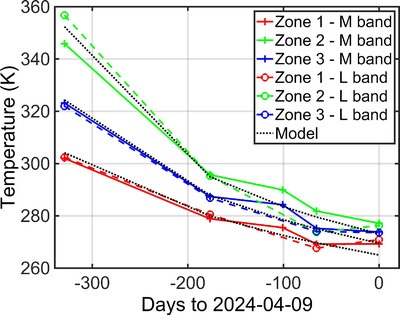
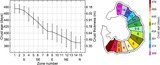
Caption: Figure 2.
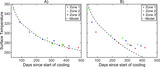
Temporal variability of the retrieved temperatures in the three zones. Data related to the first point of the M band in zone 2 are saturated; this explains why the M-band temperature (345 K) is lower than the L-band one (∼355 K). The dotted lines represent the model fit in the three cases (see Section 3).
Other Images in This Article
Copyright and Terms & Conditions
© 2025. The Author(s). Published by the American Astronomical Society.
Copyright ©
2026 Astronomy Image Explorer. All Rights Reserved.