Image Details
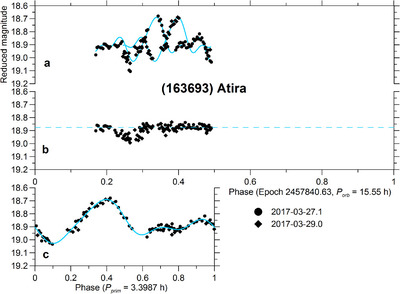
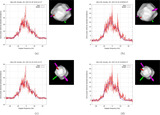
Caption: Figure 9.
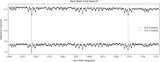
Atira lightcurve from 2017 March 27 and 29. (a) The data showing all lightcurve components, folded with the apparent orbital period. (b) The secondary/orbital lightcurve component, derived after subtraction of the primary lightcurve component, showing the brightness attenuations caused by mutual events between the binary system components at orbital phases from 0.22 to 0.30. (c) The primary lightcurve component, folded with the synodic rotation period. The blue curve is the fourth-order Fourier series fitted to the primary lightcurve data.
Other Images in This Article
Show More
Copyright and Terms & Conditions
© 2024. The Author(s). Published by the American Astronomical Society.
Copyright ©
2026 Astronomy Image Explorer. All Rights Reserved.