Image Details
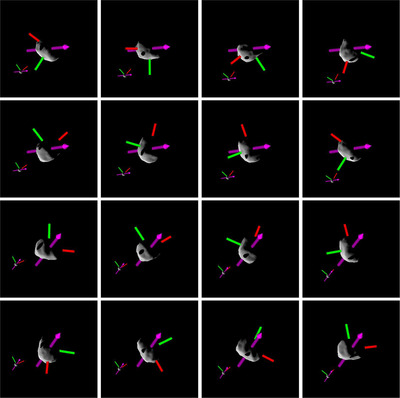
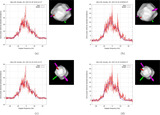
Caption: Figure 10.
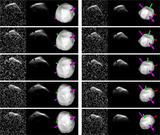
Results of the simulated orbit using SHAPE, specifically at times of mutual events. Each row contains one simulated observation window with dates (from top to bottom): 2017 February 25, 2017 February 27, 2017 March 27, and 2017 March 29. Images (per row) are separated in time by roughly 20 minutes. The red and green arrows represent the principal axes of each body, and the purple arrow represents the spin axis of each body. The orientation of the primary (and the asteroid system) is ecliptic longitude, ecliptic latitude (187°, −53°). These figures indicate that the orbital solution of the secondary and the pole orientation of the system show the timing of eclipse events that correctly correspond with the timing of mutual events observed in the lightcurve data.
Other Images in This Article
Show More
Copyright and Terms & Conditions
© 2024. The Author(s). Published by the American Astronomical Society.