Image Details
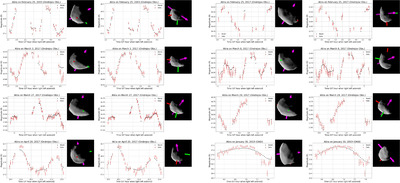
Caption: Figure 7.
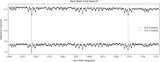
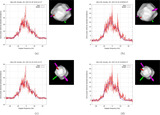
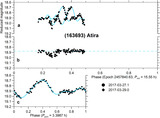
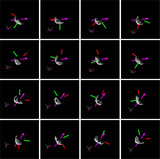
Observed lightcurves (red) and model lightcurves (black) for the two overall best-fitting models. The left column is ecliptic longitude, ecliptic latitude (150°, −10°) and a volume-equivalent diameter of ∼7 km; the right column is ecliptic longitude, ecliptic latitude (187°, −53°) and a volume-equivalent diameter of ∼5 km. For each panel, the shape model on the right is the simulated plane-of-sky image as observed during the middle of the observation. Note that lightcurves from different dates have different amplitudes, so these different frames are plotted with different ranges along their y-axes.
Other Images in This Article
Show More
Copyright and Terms & Conditions
© 2024. The Author(s). Published by the American Astronomical Society.