Image Details
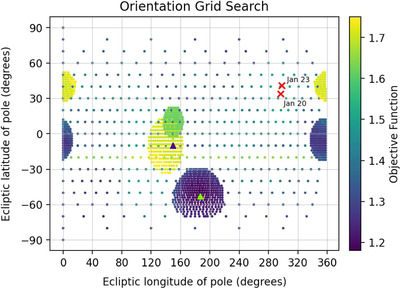
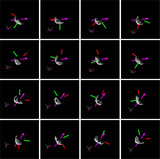
Caption: Figure 4.
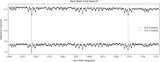
Results of a coarse, 10° increment pole search across the entire celestial sphere with finer, 3° increment grid searches conducted near local minima (seen as the several large groupings) using ellipsoidal models. Each data point represents a model with a specific ecliptic latitude and ecliptic longitude, and the color of the data point represents the value of the objective function (see Section 3 for details), where a darker color means a better fit. The green triangle is the orientation of the best-fitting, ∼5 km model, and the purple triangle is the orientation of the alternate, ∼7 km model. Note that the group of models near longitude 0°, latitude −10° are darker in color; however, these models were ruled out based on being too small in size, ∼4 km equivalent diameter, to match delay-Doppler observations. The red crosses are the line of sight to Atira during radar observations and are annotated with their corresponding observed date.
Other Images in This Article
Show More
Copyright and Terms & Conditions
© 2024. The Author(s). Published by the American Astronomical Society.