

Image Details
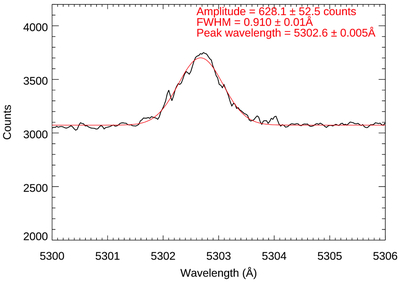
Caption: Figure 12.
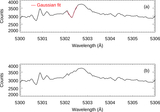
The observed emission profile at a spatial location (in black), along with the corresponding Gaussian fit (in red). The derived emission-line parameters, peak intensity, line width, and center wavelength of the emission line, along with their uncertainties, are indicated in the plot.
Other Images in This Article
Show More
Copyright and Terms & Conditions
© 2026. The Author(s). Published by the American Astronomical Society.

Copyright ©
2026 Astronomy Image Explorer. All Rights Reserved.
