

Image Details
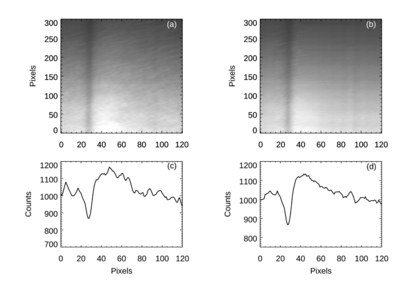
Caption: Figure 6.
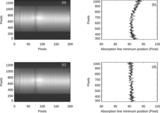
Panel (a) shows a close-up view of the slit 4 spectrum inside the boxed region in Figure 4(a). A random pattern can be noticed in the spectrum. The white patch in the lower half of the spectrum near x-axis pixels 40 and 60 is due to 5303 Å emission. The vertical black patch is due to the strong 5302.3 Å absorption line. Panel (b) shows the spectrum obtained after corrections for the random pattern. Panels (c) and (d) show the spectral profiles before and after correction, respectively.
Other Images in This Article
Show More
Copyright and Terms & Conditions
© 2026. The Author(s). Published by the American Astronomical Society.

Copyright ©
2026 Astronomy Image Explorer. All Rights Reserved.
