

Image Details
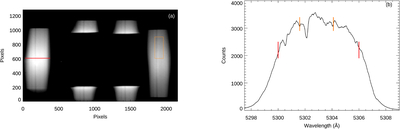
Caption: Figure 4.
Panel (a) is same as Figure 3, but after dark subtraction, flat-fielding, and left–right reversal. The boxed region in slit 4 is explained in Section 3.4.1 and Figure 6. The four vertical red and orange lines (1–4, from left to right) on the spectral profile in panel (b) indicate the different regions of transmission in the filter mentioned in the main text.
Other Images in This Article
Show More
Copyright and Terms & Conditions
© 2026. The Author(s). Published by the American Astronomical Society.

Copyright ©
2026 Astronomy Image Explorer. All Rights Reserved.
