

Image Details
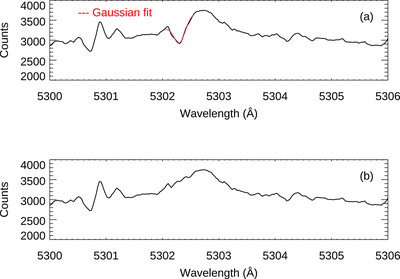
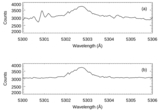
Caption: Figure 9.
Panel (a) shows the strong photospheric absorption line at 5302.3 Å blended at the edge of the emission line. The profile in red color is the Gaussian fit to the absorption line. Panel (b) shows the emission profile after the removal of the absorption-line contribution. The absorption line at 5300.7 Å is left uncorrected (Section 3.4.5).
Other Images in This Article
Show More
Copyright and Terms & Conditions
© 2026. The Author(s). Published by the American Astronomical Society.

Copyright ©
2026 Astronomy Image Explorer. All Rights Reserved.
