

Image Details
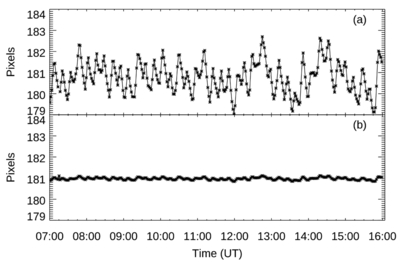
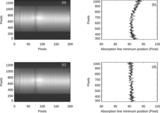
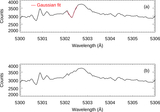
Caption: Figure 8.
Panels (a) and (b) show the pixel position of the 5302.3 Å absorption-line minimum for slit 1, as a function of time, before and after spectral drift correction, respectively. Each data point is an average of ≈800 pixels along the spatial direction of the slit. The location of the absorption line in the slit can be seen in Figure 4.
Other Images in This Article
Show More
Copyright and Terms & Conditions
© 2026. The Author(s). Published by the American Astronomical Society.

Copyright ©
2026 Astronomy Image Explorer. All Rights Reserved.
