

Image Details
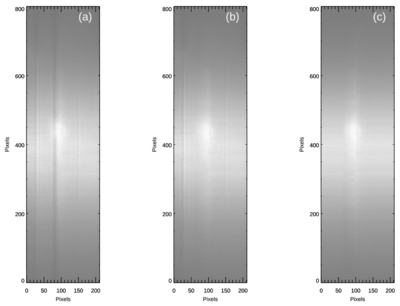
Caption: Figure 11.
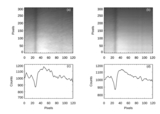
Panel (a): spectral image after dark subtraction and flat-field correction. Panel (b): spectral image after compensating for the contribution due to the photospheric absorption line at 5302.3 Å. Panel (c): final spectral image after correcting for the filter transmission profile.
Other Images in This Article
Show More
Copyright and Terms & Conditions
© 2026. The Author(s). Published by the American Astronomical Society.

Copyright ©
2026 Astronomy Image Explorer. All Rights Reserved.
