

Image Details
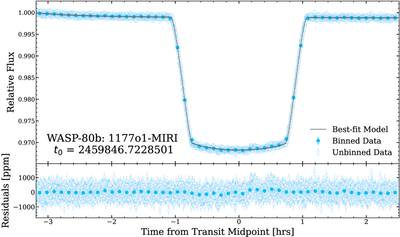
Caption: Figure 2.
White light-curve example: reduced white light curves and fitting results for WASP-80 b (ID: 1177o1-MIRI, proposal ID 1177, observation one, and observed with the JWST MIRI instrument). The top panel shows the relative flux light curve, while the bottom panel displays the corresponding residuals. Unfilled blue points represent unbinned data, while solid blue points show 50-point binned data. The black line indicates the best-fitting model.
Other Images in This Article
Show More
Copyright and Terms & Conditions
© 2026. The Author(s). Published by the American Astronomical Society.

Copyright ©
2026 Astronomy Image Explorer. All Rights Reserved.
