

Image Details
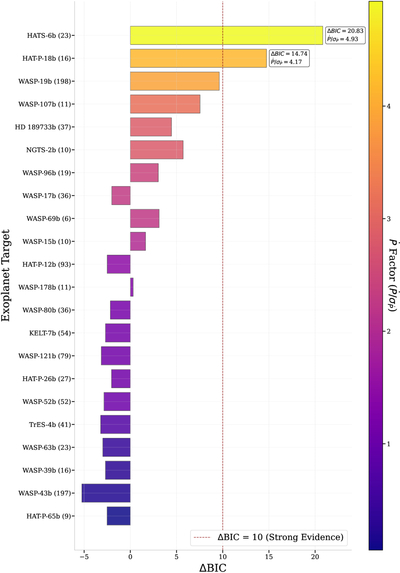
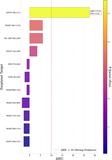
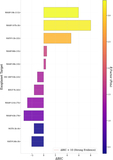
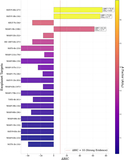
Caption: Figure 5.
Long-term TTV candidates from the full dataset. Comparison of the quadratic model against the linear model for targets with more than five transit times. The red dashed line marks ΔBIC = 10. The color bar encodes the period-derivative significance ﹩\dot{P}/{\sigma }_{\dot{P}}﹩. Targets satisfying ΔBIC > 10 and ﹩\dot{P}/{\sigma }_{\dot{P}}\gt 3﹩ are annotated.
Other Images in This Article
Show More
Copyright and Terms & Conditions
© 2026. The Author(s). Published by the American Astronomical Society.

Copyright ©
2026 Astronomy Image Explorer. All Rights Reserved.
