

Image Details
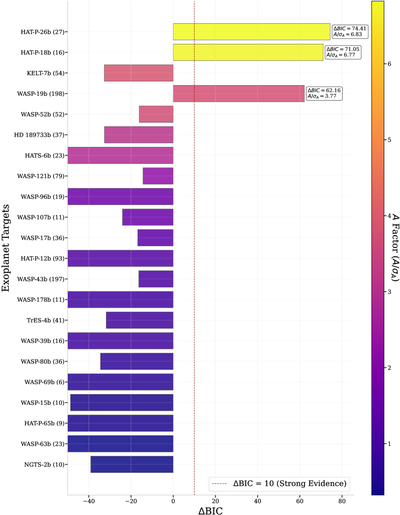
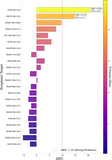
Caption: Figure 10.
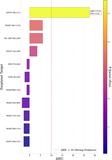
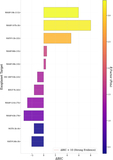
Short-term periodic TTV candidates from the full dataset. Comparison of the sine model against the linear model for targets with more than five transit times. The red dashed line marks ΔBIC = 10. The color bar encodes the amplitude significance A/σA. Targets satisfying ΔBIC > 10 and A/σA > 3 are annotated. Targets with ΔBIC < −50 have been cut off for visibility.
Other Images in This Article
Show More
Copyright and Terms & Conditions
© 2026. The Author(s). Published by the American Astronomical Society.

Copyright ©
2026 Astronomy Image Explorer. All Rights Reserved.
