

Image Details
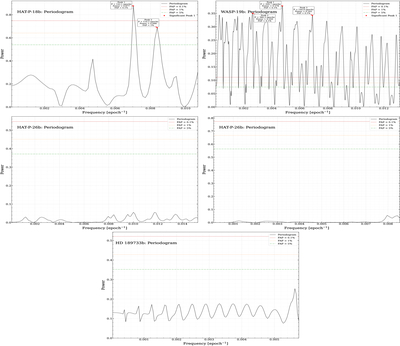
Caption: Figure 16.
GLS periodograms for sine-signal candidates. Top row: HAT-P-18 b and WASP-19 b (full dataset). Middle row: HAT-P-26 b with (left) and without (right) ground-based data. Bottom: HD 189733 b after excluding ground-based data. Colored dashed lines indicate FAP thresholds, and prominent peaks are annotated.
Other Images in This Article
Show More
Copyright and Terms & Conditions
© 2026. The Author(s). Published by the American Astronomical Society.

Copyright ©
2026 Astronomy Image Explorer. All Rights Reserved.
