

Image Details
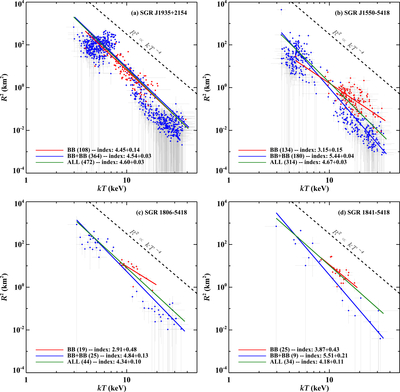
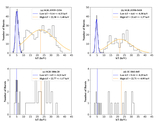
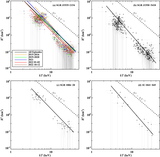
Caption: Figure 9.
R2 vs. kT trends of the burst spectra that only preferred the single-BB (red) or BB + BB (blue) model for the sources (a) SGR J1935+2154, (b) SGR J1550–5418, (c) SGR 1806−20, and (d) 1E 1841−045. The best-fitting PL model is overlaid on each distribution.
Other Images in This Article
Copyright and Terms & Conditions
© 2026. The Author(s). Published by the American Astronomical Society.

Copyright ©
2026 Astronomy Image Explorer. All Rights Reserved.
