

Image Details
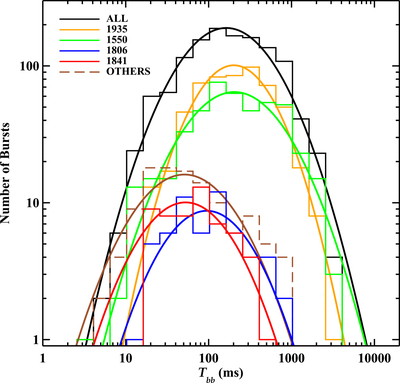
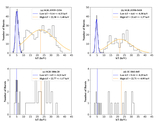
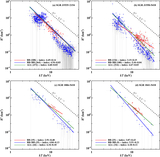
Caption: Figure 2.
Tbb distribution of all sample (black), SGR J1935+2154 (orange), SGR J1550−5418 (green), SGR 1806−20 (blue), 1E 1841−045 (red), and others (brown dashed line). The best-fitting Gaussian model is overlaid on each distribution. The logarithmic y-axis is used solely to better illustrate the differences in the duration distributions among the magnetars.
Other Images in This Article
Copyright and Terms & Conditions
© 2026. The Author(s). Published by the American Astronomical Society.

Copyright ©
2026 Astronomy Image Explorer. All Rights Reserved.
