

Image Details
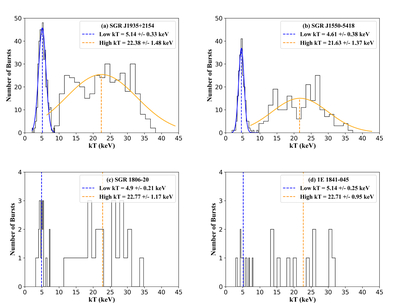
Caption: Figure 6.
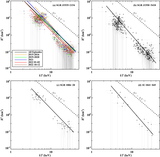
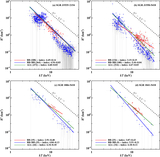
The low and high kT distributions for the spectra that prefer BB + BB model. Each prolific magnetar is shown separately in (a) SGR J1935+2154 (N = 75), (b) SGR J1550−5418 (N = 200), (c) SGR 1806−20 (N = 25), and (d) 1E 1841−045 (N = 11). For (a) and (b), the Gaussian fits and means are shown with the curves and the dashed lines, respectively. For (c) and (d), the weighted mean is shown instead due to poor Gaussian fits of low counts.
Other Images in This Article
Copyright and Terms & Conditions
© 2026. The Author(s). Published by the American Astronomical Society.

Copyright ©
2026 Astronomy Image Explorer. All Rights Reserved.
