

Image Details
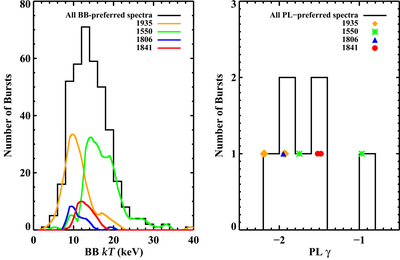
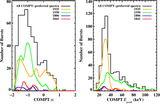
Caption: Figure 4.
Left: the distribution of kT parameter of 386 spectra that prefer BB model is shown in black. The same distribution profiles for the most burst prolific magnetars in our sample, SGR J1935+2154 (N = 119), SGR J1550–5418 (N = 154), SGR 1806−20 (N = 19), and 1E 1841−045 (N = 27), are shown on both panels in orange, green, blue, and red, respectively. The source specific histograms are smoothed only for clearer presentation. Right: the distribution of γ parameter of seven spectra that favor PL model is shown in black.
Other Images in This Article
Copyright and Terms & Conditions
© 2026. The Author(s). Published by the American Astronomical Society.

Copyright ©
2026 Astronomy Image Explorer. All Rights Reserved.
