

Image Details
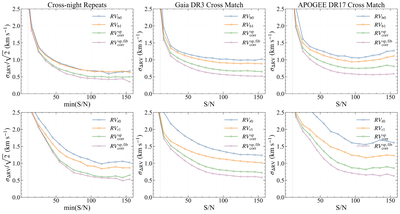
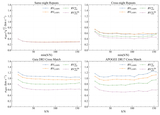
Caption: Figure 7.
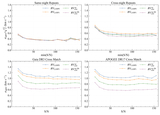
Residual scatter versus LAMOST MRS S/N for blue- and red-arm RVs in three validation tests. Top/bottom rows show the blue/red arm; left to right: cross-night repeats, residuals relative to Gaia DR3–corrected RVs, and residuals relative to APOGEE DR17. Curves correspond to the raw RVs (RVb0 or RVr0; blue), the pipeline zero-point-corrected RVs (RVb1 or RVr1; orange), the spectrograph–exposure correction (﹩{\mathrm{RV}}_{\mathrm{corr}}^{\mathrm{sp}}﹩; green), and the full two-level correction (﹩{\mathrm{RV}}_{\mathrm{corr}}^{\mathrm{sp},\mathrm{fib}}﹩; purple). In each S/N bin, σ is obtained from a Gaussian fit to the core of the residual distribution. For cross-night repeats, pairs are observations of the same source separated by ≥365 days; observations from 2017 are excluded, and we require ﹩| {({\rm{S}}/{\rm{N}})}_{1}-{({\rm{S}}/{\rm{N}})}_{2}| /{\rm{\max }}[{({\rm{S}}/{\rm{N}})}_{1},{({\rm{S}}/{\rm{N}})}_{2}]\,\leqslant \,0.30﹩. Pairs are binned by the lower S/N, and the pairwise scatter is divided by ﹩\sqrt{2}﹩ to report the single-observation precision. For the Gaia and APOGEE comparisons, σ is measured from LAMOST–reference RV differences and is not divided by ﹩\sqrt{2}﹩; the Gaia sample is restricted to rv_gaiadr3_err < 0.5 km s−1. The vertical dotted line marks S/N = 10, the LASP lower limit. Results are shown up to S/N = 160; the S/N < 10 scatter lies above the plotted range and is reported in the text. The two-level correction improves both cross-night repeatability and agreement with the external references for both arms.
Other Images in This Article
Show More
Copyright and Terms & Conditions
© 2026. The Author(s). Published by the American Astronomical Society.

