

Image Details
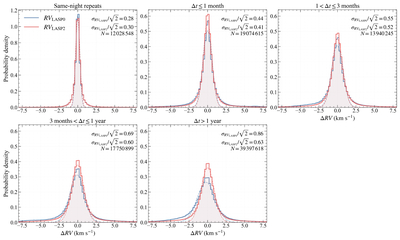
Caption: Figure 6.
Probability density of pairwise RV differences for repeat observations of the same source, stratified by time interval between visits. From left to right and top to bottom, the panels show same-night repeats, Δt ≤ 1 month, 1 < Δt ≤ 3 months, 3 months < Δt ≤ 1 yr, and Δt > 1 yr. Blue and red histograms show the precorrection RVLASP0 and the two-level-corrected RVLASP2 pairwise differences, respectively, each normalized to unit area. Dashed curves are Gaussian fits to the core of each distribution, with the fitted dispersion σ divided by ﹩\sqrt{2}﹩ to represent the single-measurement precision. N denotes the number of pairs in each panel. The precorrection scatter increases monotonically with time interval, reflecting growing zero-point systematics, while the two-level correction removes a progressively larger fraction of the systematic contribution.
Other Images in This Article
Show More
Copyright and Terms & Conditions
© 2026. The Author(s). Published by the American Astronomical Society.

