

Image Details
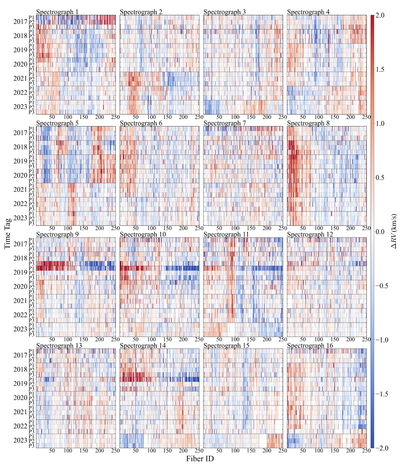
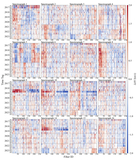
Caption: Figure 4.
Fiber–time RVZP correction map. Each panel shows one spectrograph: the x-axis is fiberid (250 fibers) and the y-axis orders time_tag bins from early to late, with P1–P3 marking the three segments of each observing year (September–June; e.g., 2017 P2 falls in early 2018). Each cell is one (spid, fiberid, time_tag) correction for the corresponding spectrograph panel, color coded in km s−1 over [−2, 2]. Gray vertical dashed lines separate 25-fiber bundles and gray horizontal dashed lines separate observing years. The remaining coherent structure after the spectrograph–exposure correction motivates the second-level fiber–time correction.
Other Images in This Article
Show More
Copyright and Terms & Conditions
© 2026. The Author(s). Published by the American Astronomical Society.

