

Image Details
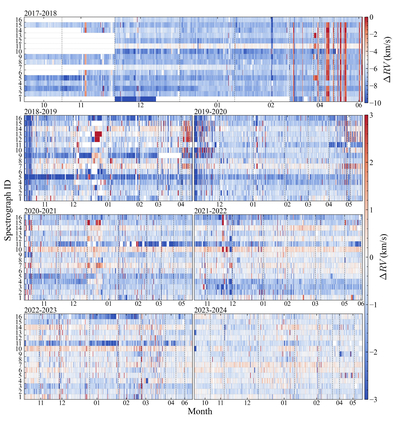
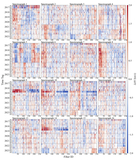
Caption: Figure 2.
Seasonal heatmap of the spectrograph–exposure RVZP correction, shown by observing season. In each panel, rows correspond to spectrographs, the x-axis is time, and each cell is one spectrograph–exposure unit (one LMJM exposure). Colors show the correction (km s−1). We use [−10, 0] for 2017–2018 because its zero-point level is offset relative to later seasons; all other seasons use [−3, 3]. Gray vertical dashed lines mark the starts of MRS observing cycles within the alternating MRS/LRS schedule. The plot illustrates the strong time- and spectrograph-dependent structure that motivates the spectrograph–exposure correction.
Other Images in This Article
Show More
Copyright and Terms & Conditions
© 2026. The Author(s). Published by the American Astronomical Society.

