

Image Details
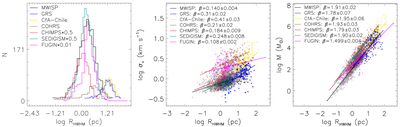
Caption: Figure 7.
Histogram of radius (left), radius–velocity dispersion relation (middle), and radius–mass relation (right) for well-resolved MWISP clouds (12CO, 13CO, and C18O J = 1–0), overlaid with those of well-resolved clouds from other literature catalogs. These include GRS (13CO J = 1–0; J. M. Rathborne et al. 2009; J. Roman-Duval et al. 2009, 2010), CfA-Chile (12CO J = 1–0; T. S. Rice et al. 2016), COHRS (12CO J = 3–2; D. Colombo et al. 2019), CHIMPS (13CO and C18O J = 3–2; A. J. Rigby et al. 2019), SEDIGISM (13CO J = 2–1; A. Duarte-Cabral et al. 2021), and FUGIN (12CO, 13CO, and C18O J = 1–0; S. Fujita et al. 2023). Cloud radii are defined as the half-width at half-maximum (HWHM). In the middle and right panels, the MWISP point density is shown on a square-root scale. The other samples are represented by blue stars (GRS), yellow squares (CfA-Chile), brown crosses (COHRS), red plus signs (CHIMPS), green triangles (SEDIGISM), and magenta diamonds (FUGIN). For clarity, only 200 randomly selected clouds from each sample are displayed. Linear fits are performed on all well-resolved samples for the radius–mass and radius–velocity dispersion relations. The parameters are in log form, and therefore, the linear fit is equivalent to a power-law fit in the original variables. The best-fit results are indicated by solid lines, and their slopes are noted in the upper-left corners of the respective panels.
Other Images in This Article

Copyright and Terms & Conditions
© 2026. The Author(s). Published by the American Astronomical Society.

