

Image Details
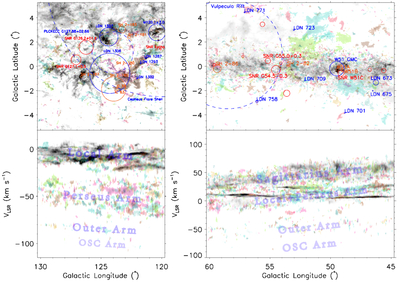
Caption: Figure 2.
12CO (J = 1–0) integrated intensity map, along with corresponding Galactic longitude–velocity (l-v) map, for the G120 (left) and G50 (right) regions. The MCs studied here are overlaid in color, with each cloud shown by a distinct random color. The data are initially moment-masked (see T. M. Dame 2011 for reference) to suppress noise while integrating over large velocity ranges. The minimum values of the maps are zero, and the intensity is on a linear scale. The maximum values of the integrated intensity maps are 41.9 and 166.1 K km s−1 for the G120 and G50 regions, respectively. Integrated intensities greater than these maxima are truncated for better visibility. Some well-studied objects in the region, including supernova remnants (red), H II regions (orange), and others (blue), are indicated by circles (see X. Zhou et al. 2025, and references therein, for details). The approximate locations of the different spiral arms are also indicated on the l-v map.
Other Images in This Article

Copyright and Terms & Conditions
© 2026. The Author(s). Published by the American Astronomical Society.

