

Image Details
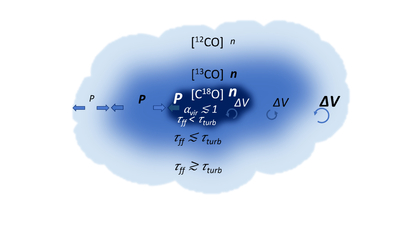
Caption: Figure 5.
Schematic view of the MC structure, illustrated with typical parameter values estimated using 12CO, 13CO, and C18O (J = 1–0) lines. The size of each parameter sign indicates the magnitude of the typical value. Color depth indicates H2 number density (n), thick arrows indicate pressure (P), and circular arrows indicate turbulence (Δv). The actual 13CO- and C18O-bright regions are smaller than shown in the schematic, and some of them are clumpy. The typical area ratio of 13CO to 12CO is ∼0.26 for the overall MC sample. For MCs with significant C18O emission, the typical area ratio of 13CO to 12CO is ∼0.45, and the C18O to 12CO ratio is ∼0.06. The stratified structure of 12CO and 13CO remains valid for MCs in which no C18O emission is detected.
Other Images in This Article

Copyright and Terms & Conditions
© 2026. The Author(s). Published by the American Astronomical Society.

