Image Details
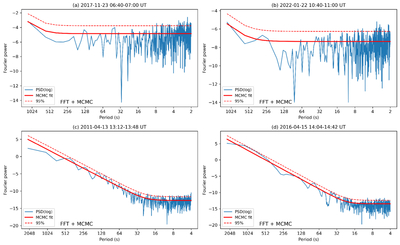
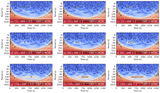
Caption: Figure 8.
Fourier power spectra from representative GOES 1–8 Å time-series segments. The spectra are fitted with the model P(f) = Af−α + C. A power-law trend is present at low frequencies, with a gradual flattening at higher frequencies. The fitted spectral indices lie in the range α ∼ 2.5–4.5.
Other Images in This Article
Copyright and Terms & Conditions
© 2026. The Author(s). Published by the American Astronomical Society.
Copyright ©
2026 Astronomy Image Explorer. All Rights Reserved.