Image Details
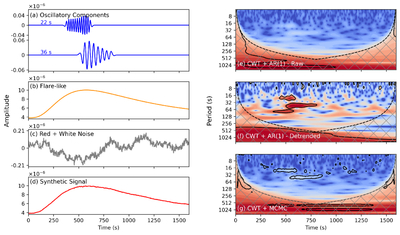
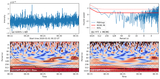
Caption: Figure 2.
Synthetic test with a simple signal. (a)–(d) Individual components: oscillatory signal, flare background, red + white noise, synthetic signal. (e) Wavelet power spectrum from the standard CWT+AR(1) method. (f) Result after detrending (80 s) followed by CWT+AR(1) analysis. (g) Result from the CWT+MCMC method. Black contours indicate the 95% confidence level.
Other Images in This Article
Copyright and Terms & Conditions
© 2026. The Author(s). Published by the American Astronomical Society.
Copyright ©
2026 Astronomy Image Explorer. All Rights Reserved.