Image Details
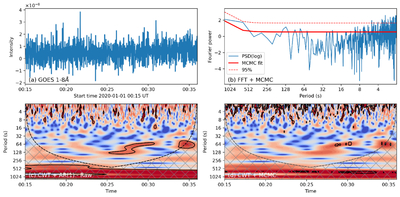
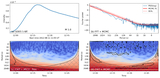
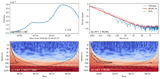
Caption: Figure 5.
GOES 1–8 Å light curve for a quiet-Sun interval. (a) Observed soft X-ray flux. (b) Fourier power spectrum (FFT+MCMC). (c) Wavelet power spectrum from the CWT+AR(1) method. (d) Wavelet power spectrum from the CWT+MCMC method. A localized feature near ∼128 s is present in panel (c) but not in the other representations. Black contours indicate the 95% confidence level.
Other Images in This Article
Copyright and Terms & Conditions
© 2026. The Author(s). Published by the American Astronomical Society.
Copyright ©
2026 Astronomy Image Explorer. All Rights Reserved.