Image Details
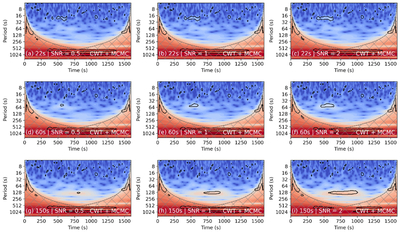
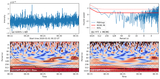
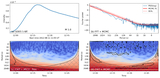
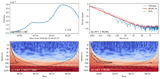
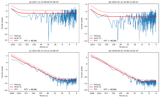
Caption: Figure 4.
Detection results for different signal-to-noise ratios (SNRs) and oscillation periods. Three representative periods are considered: 22 s (top), 60 s (middle), and 150 s (bottom). Columns correspond to SNR = 0.5, 1, and 2. Black contours indicate regions above the 95% confidence level.
Other Images in This Article
Copyright and Terms & Conditions
© 2026. The Author(s). Published by the American Astronomical Society.
Copyright ©
2026 Astronomy Image Explorer. All Rights Reserved.