Image Details
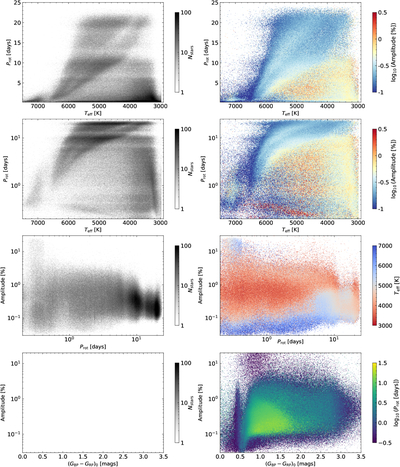
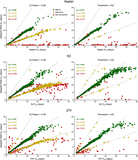
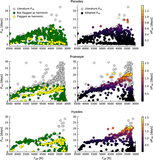
Caption: Figure 7.
The default TARS sample as functions of period, temperature, and amplitude. Top two rows: rotation–effective temperature diagrams with linear-scaled Prot (top row) and log-scaled Prot. The left panel presents the number density of stars across the sample, while the right panel colors each bin by the median amplitude of the rotators in that bin. Middle row: rotation–amplitude diagram with log-scaled Prot. The bins in the right column are colored by median effective temperature. Bottom row: color–amplitude diagram colored by number of stars on the left and Prot on the right. The structure in these plots is discussed in Section 7.
Other Images in This Article
Show More
Copyright and Terms & Conditions
© 2026. The Author(s). Published by the American Astronomical Society.