Image Details
Caption: Figure 10.
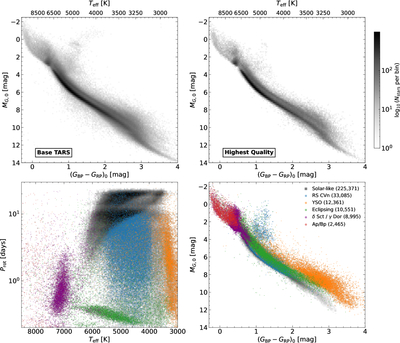
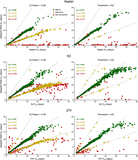
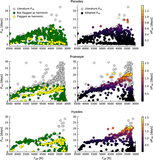
Gaia DR3 variability classifications in period–temperature and color–magnitude space. Left: period vs. effective temperature for stars in the TARS catalog crossmatched with the Gaia DR3 vari_classifier_result table. Right: dereddened color–magnitude diagram for the same sources. Points are colored by Gaia variability class: solar-like modulation (gray), RS CVn systems (blue), young stellar objects (pink), eclipsing binaries (orange), δ Scuti/γ Doradus pulsators (green), and chemically peculiar Ap/Bp stars (yellow). The number of stars in each class is listed in the legend. The strong dominance of rotational classes supports the conclusion that the vast majority of measured TARS periods correspond to stellar rotation.
Other Images in This Article
Show More
Copyright and Terms & Conditions
© 2026. The Author(s). Published by the American Astronomical Society.