Image Details
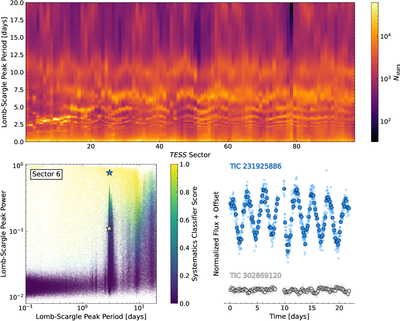
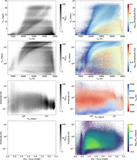
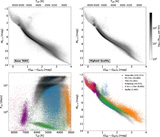
Caption: Figure 3.
Systematics masquerade as period detections. Top: the period of the highest peak in the Lomb–Scargle (L-S) periodogram across all TESS sectors. The sinusoidal structures across sectors are harmonics of the TESS data gap. Bottom left: our systematics classifier identifies and separates systematics from other rotation signals. The systematics classifier is trained so rotation measurements with a high probability are more likely to be real signals and less likely to be a systematic. Sector 6 experienced momentum dumps every 3.125 days. The blue and gray stars show the L-S period and power of the two light curves in the bottom-right panel. Bottom right: TIC 231925886 and TIC 302869120 both have L-S peak periods of ∼2.9 days in Sector 6, but TIC 231925886 has a systematics classifier score of 1.0 (high probability of being a rotation signal) while TIC 302869120 has a systematics classifier score of 0.0 (high probability of being a systematic).
Other Images in This Article
Show More
Copyright and Terms & Conditions
© 2026. The Author(s). Published by the American Astronomical Society.