Image Details
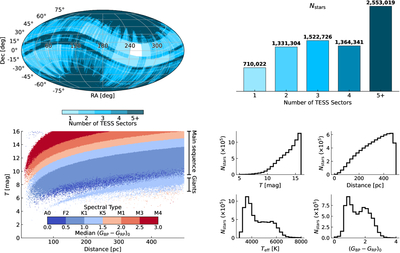
Caption: Figure 1.
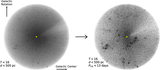
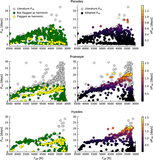
Selection function. Top left: sky coverage. We used TESS images from 2018 July–2025 September; the white gap is where TESS did not observe in Sectors 1–96. Top right: histogram of number of TESS observations per star; numbers above each bin give the star count. The median star has four sectors of TESS data. Bottom left: the TESS magnitude T as a function of the distance to each star in our survey, colored by the median dereddened Gaia DR3 GBP − GRP color in each bin. Spectral types are approximated from M. J. Pecaut & E. E. Mamajek (2013). Bottom right: histograms across our sample of magnitude, distance, temperature, and color.
Other Images in This Article
Show More
Copyright and Terms & Conditions
© 2026. The Author(s). Published by the American Astronomical Society.