Image Details
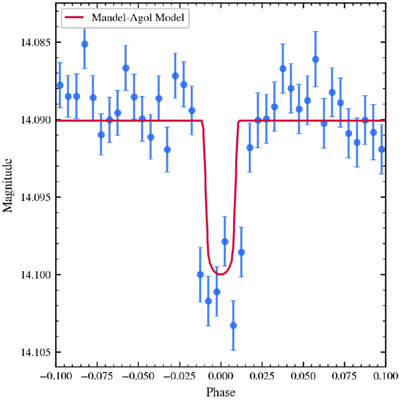
Caption: Figure 7.
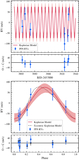
The phase-folded T16 light curve, measured in TESS sector 2, camera 2, CCD 4, in magnitude space. The data have been binned into 200 phase bins. Overplotted in red is the best-fit Mandel–Agol model, fitted using the BATMAN package (L. Kreidberg 2015).
Other Images in This Article
Show More
Copyright and Terms & Conditions
© 2026. The Author(s). Published by the American Astronomical Society.
Copyright ©
2026 Astronomy Image Explorer. All Rights Reserved.