Image Details
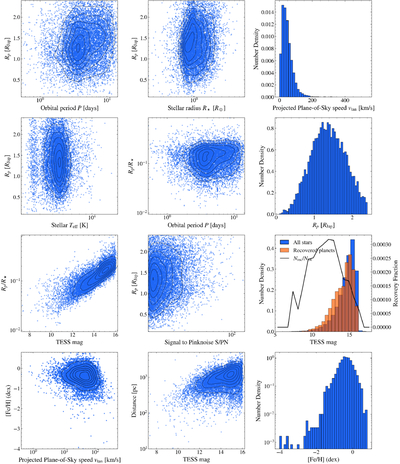
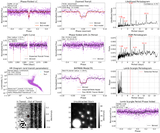
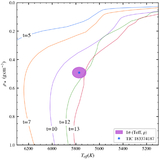
Caption: Figure 10.
Selected parameters distributions and correlations from our final sample. The orange magnitude histogram shows the TESS magnitude distribution of our candidates, as opposed to the blue histogram, which shows the magnitude distribution of all Cycle 1 samples analyzed. The black curve shows the fraction of all stars in a magnitude bin that we recovered as planet candidates. Black contours on the scatter plots indicate the smoothed two-dimensional number density of points, estimated using a Gaussian kernel density estimator. Contours are shown at fixed percentile levels of the density distribution to guide the eye. Orange points in the Mollweide projection represent known TOIs/CTOIs recovered by this search. Blue points indicate the Galactic positions of all candidates identified in this work.
Other Images in This Article
Show More
Copyright and Terms & Conditions
© 2026. The Author(s). Published by the American Astronomical Society.