Image Details
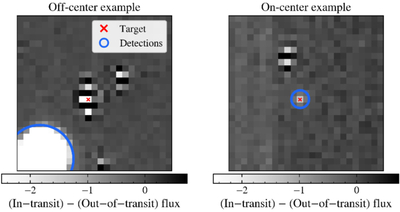
Caption: Figure 3.
Left: example of automated off-center source detection. This example shows an off-center residual, indicating a blend as the source of the measured variability. The checkered pattern at the source position is consistent with Poisson noise or imperfect image subtraction due to the brightness of the source. Right: localized, on-center residual, indicating that the variability is due to the target.
Other Images in This Article
Show More
Copyright and Terms & Conditions
© 2026. The Author(s). Published by the American Astronomical Society.
Copyright ©
2026 Astronomy Image Explorer. All Rights Reserved.