Image Details
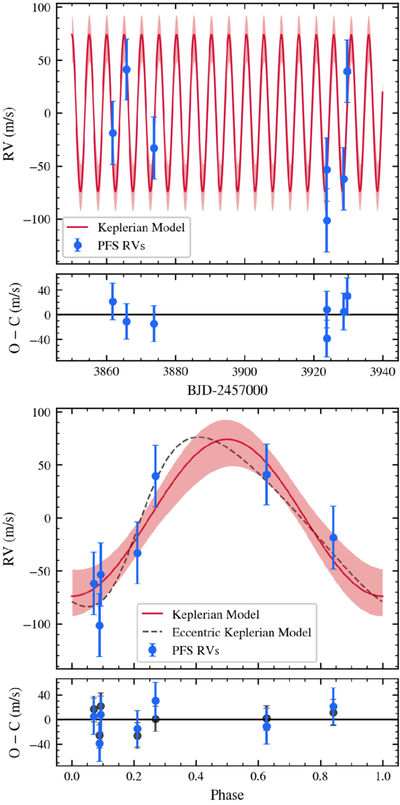
Caption: Figure 6.
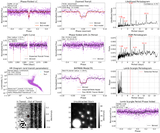
The top panel shows the seven radial velocity data points along with the best-fit Keplerian model and the corresponding 1σ uncertainty region in red. Plotted directly below are the residuals. Similarly, the bottom panel shows the phase-folded equivalent, also with corresponding residuals. The best-fit eccentric Keplerian model is shown as a dashed line, and its residuals are plotted as black data points.
Other Images in This Article
Show More
Copyright and Terms & Conditions
© 2026. The Author(s). Published by the American Astronomical Society.
Copyright ©
2026 Astronomy Image Explorer. All Rights Reserved.