Image Details
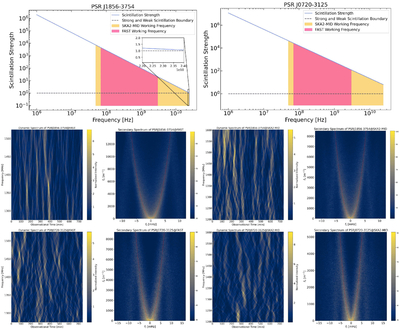
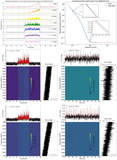
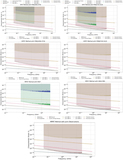
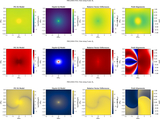
Caption: Figure 14.
Variation of interstellar scintillation intensity with frequency and simulated observations of several pulsars using different telescopes, incorporating dynamic and second-order dynamic spectra. The upper panel shows the interstellar scintillation intensity versus observation frequency. The scintillation intensity is shown by the solid blue line, and the operational frequencies of FAST and SKA2-MID are shown by the filled areas of different colors. The central and lower panels sequentially display the 12 hr dynamic and second-order dynamic spectra of pulsars J1856-3754 and J0720-3125 under FAST and SKA2-MID observational circumstances.
Other Images in This Article
Show More
Copyright and Terms & Conditions
© 2026. The Author(s). Published by the American Astronomical Society.