Image Details
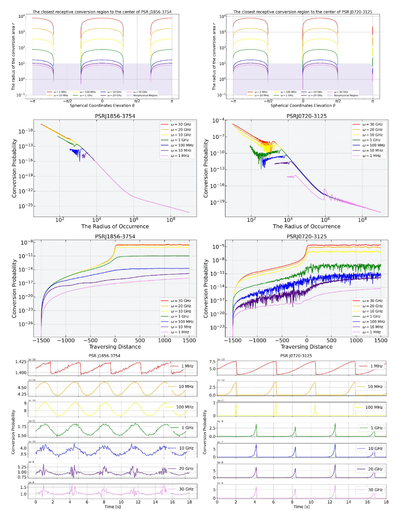
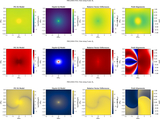
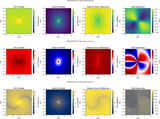
Caption: Figure 7.
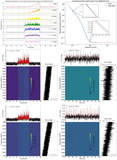
The inverse GZ effect in the radius of the nearest detectable signal-generating region in the pulsar magnetosphere away from the center of the pulsar and the conversion probability of converting GWs to radio signals. The four left panels plot the results for PSR J1856-3754 and the four right panels depict the results for PSR J0720-3125. The top panel plots the region of permissible signal conversions for the two pulsars; we assume that the neutron star has a radius of 10 km, so we have shaded regions smaller than 10 km in purple to indicate unphysical regions. The second panel plots the magnitude of the conversion probability at different positions of the two pulsars, in this plot we assume that the conversion occurs on the x-axis of the PIC simulation. The third panel plots the magnitude of the conversion probabilities at different crossing distances in the magnetic fields of the two pulsars, in this panel we assume that the conversion occurs in the region of occurrence closest to the neutron star. The bottom panel plots the magnitude of the conversion probabilities at different times in the magnetic fields of the two pulsars. In this panel, we assume that the conversion occurs in the region of occurrence closest to the neutron star. The plotted length of time corresponds to at least two rotation periods of the pulsar.
Other Images in This Article
Show More
Copyright and Terms & Conditions
© 2026. The Author(s). Published by the American Astronomical Society.