Image Details
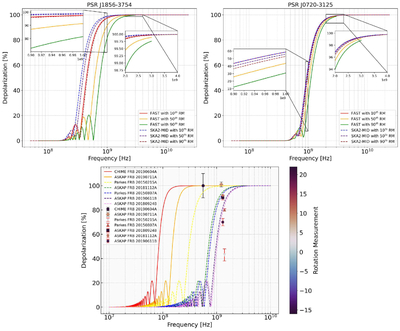
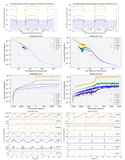
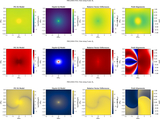
Caption: Figure 5.
The linear polarization of a GW radio signal varies with frequency. The two diagrams in the top row show the radio signals from PSR J1856-3754 and PSR J0720-3125, with FAST’s signal represented by a colored solid line and SKA2-MID’s signal represented by a colored dashed line. The bottom panel shows the fit of the depolarization theory of our signals to several examples of intragalactic FRB signals, where the colored solid lines indicate the results of our fits to the repeated FRBs and the colored dashed lines indicate the results of our fits to the nonrepeated FRBs. Different FRBs are represented by different shapes whose colors indicate the magnitude of the RM, with the line-polarized error bars of repeated FRBs shown as black solid lines and those of nonrepeated FRBs shown as red solid lines.
Other Images in This Article
Show More
Copyright and Terms & Conditions
© 2026. The Author(s). Published by the American Astronomical Society.