Image Details
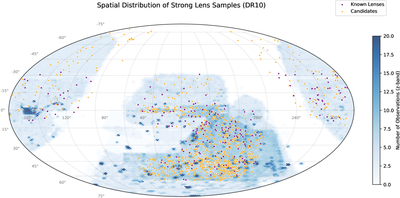
Caption: Figure 2.
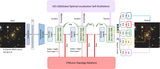
Distribution of known strong lenses (purple) and lens candidates (orange) used in this work. The background shading indicates the z-band observation depth, traced by the number of observations. The sample is primarily concentrated in the southern DECam footprint, consistent with the higher z-band coverage in that region.
Other Images in This Article
Copyright and Terms & Conditions
© 2026. The Author(s). Published by the American Astronomical Society.
Copyright ©
2026 Astronomy Image Explorer. All Rights Reserved.