Image Details
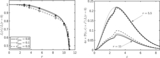
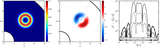
Caption: Figure 10.
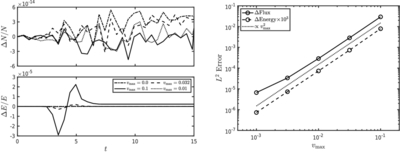
The left panels show Eulerian-frame number and energy conservation for the transparent vortex test. The top-left panel shows the relative change in the Eulerian-frame particle number vs. time, while the bottom-left panel shows the relative change in the Eulerian-frame particle energy vs. time. In each of these panels, the change is relative to the respective value at t = 15 (see the text for details). In both left panels, results are plotted for models with different values of ﹩{v}_{{{\rm{\max }}}}﹩: 0.0 (dash dot), 0.1 (solid), 0.032 (dashed), and 0.01 (dotted). In the right panel, we plot (vs. ﹩{v}_{{{\rm{\max }}}}﹩) the L2 error norm of the particle flux at the outer boundary (solid line with circles) and the relative change in the Eulerian-frame energy (dashed line with symbols). (For plotting purposes, the energy change has been multiplied by a factor 103 to make the numerical values comparable to those for the solid line.) The dotted reference line is proportional to ﹩{v}_{{{\rm{\max }}}}^{2}﹩.
Other Images in This Article
Show More
Copyright and Terms & Conditions
© 2026. The Author(s). Published by the American Astronomical Society.