Image Details
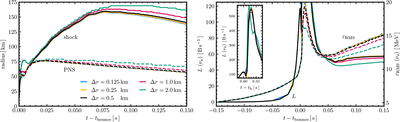
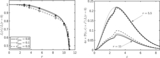
Caption: Figure 31.
Results from the spatial resolution study, showing selected quantities vs. time from simulations in which the minimum finite-volume cell width was varied, while the spectral resolution corresponds to Grid C in Table 2. The left panel shows the shock (solid lines) and PNS (dashed lines) radii as functions of time, and the right panel shows the electron-neutrino luminosity (solid lines) and rms energy (dashed lines) at r = 500 km as functions of time. Line colors indicate the minimum finite-volume radial cell width at the highest AMR level: 0.125 km (blue), 0.25 km (yellow), 0.5 km (black), 1.0 km (red), and 2.0 km (green).
Other Images in This Article
Show More
Copyright and Terms & Conditions
© 2026. The Author(s). Published by the American Astronomical Society.