Image Details
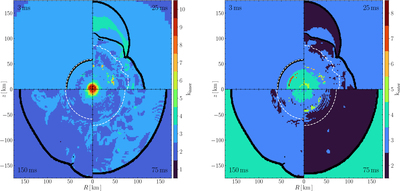
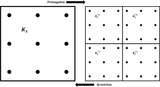
Caption: Figure 30.
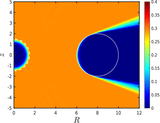
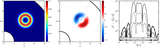
Heat maps showing the spatial distribution of the number of inner (left panels) and outer (right panels) iterations from the axisymmetric thornado+FLASH-X simulation at the same postbounce times in Figure 28. Clockwise from the top left: 3 ms, 25 ms, 75 ms, and 150 ms.
Other Images in This Article
Show More
Copyright and Terms & Conditions
© 2026. The Author(s). Published by the American Astronomical Society.
Copyright ©
2026 Astronomy Image Explorer. All Rights Reserved.