Image Details
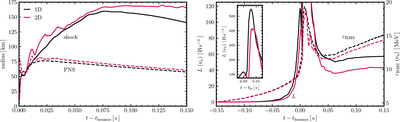
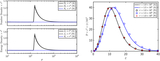
Caption: Figure 29.
Comparison of spherically symmetric (black) and axisymmetric (red) thornado+FLASH-X simulations, showing selected quantities as functions of time. The left panel plots the shock (solid lines) and PNS (dashed lines) radii, and the right panel plots the electron-neutrino luminosity (solid lines) and rms energy (dashed lines) at r = 500 km.
Other Images in This Article
Show More
Copyright and Terms & Conditions
© 2026. The Author(s). Published by the American Astronomical Society.
Copyright ©
2026 Astronomy Image Explorer. All Rights Reserved.