Image Details
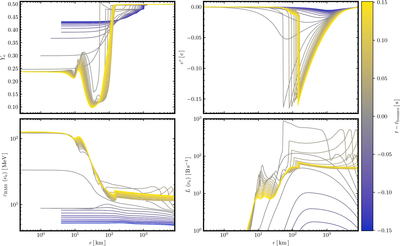
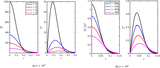
Caption: Figure 18.
Time evolution (indicated by color) of radial profiles of the electron fraction (Ye; top left), radial velocity (vr; top right), electron-neutrino rms energy (εrms(νe); bottom left), and electron-neutrino luminosity (L(νe); bottom right). The figure illustrates the collapse and postbounce evolution over a ±150 ms interval centered on core bounce. Curves represent snapshots spaced by 7.5 ms, with line color encoding time relative to bounce (blue: early prebounce; yellow: late postbounce), as shown by the color bar on the right.
Other Images in This Article
Show More
Copyright and Terms & Conditions
© 2026. The Author(s). Published by the American Astronomical Society.
Copyright ©
2026 Astronomy Image Explorer. All Rights Reserved.