Image Details
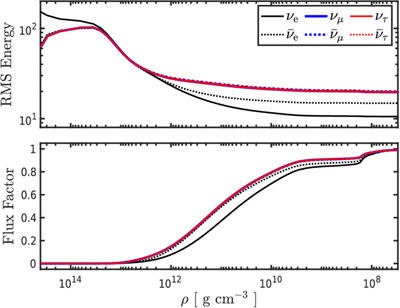
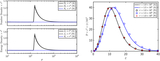
Caption: Figure 16.
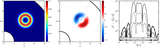
Plot of neutrino rms energy (top panel), as defined in Equation (154), and energy-averaged flux factor (bottom panel) vs. mass density for the deleptonization problem after 100 ms of evolution. In each panel, values are plotted for all six neutrino species: νe (solid black), ﹩{\bar{\nu }}_{{{\rm{e}}}}﹩ (dotted black), νμ (solid blue), ﹩{\bar{\nu }}_{\mu }﹩ (dotted blue), ντ (solid red), and ﹩{\bar{\nu }}_{\tau }﹩ (dotted red).
Other Images in This Article
Show More
Copyright and Terms & Conditions
© 2026. The Author(s). Published by the American Astronomical Society.
Copyright ©
2026 Astronomy Image Explorer. All Rights Reserved.